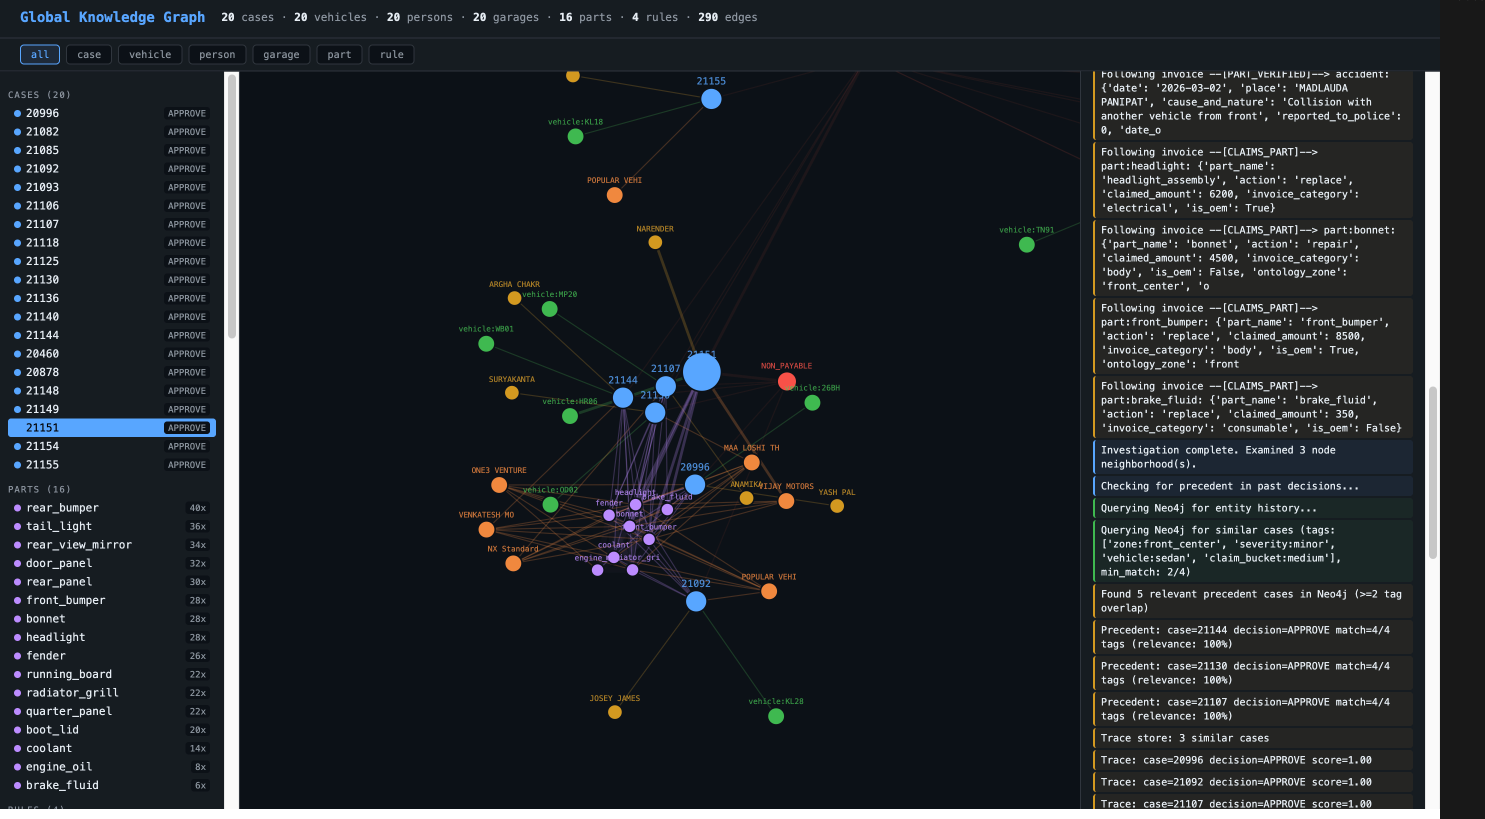
Building a Context Graph That Makes Your AI Agent Smarter With Every Run
Building the judgment layer that lives in a surveyor's head

Summary
Most AI agents are stateless wrappers around LLMs. They process each request in isolation, with no context from what they decided yesterday or why. In regulated domains like insurance, this is a dead-end.
I built a context graph for motor insurance claims, a knowledge structure where every case the agent processes makes the next case smarter. Entities, parts, costs, decisions, and the reasoning behind them accumulate into a judgment layer that mirrors what experienced surveyors carry in their heads.
By case 5, the agent was finding its own precedents. By case 20, it was flagging cost anomalies and suspicious part combinations that nobody programmed. Not from rules. From the graph growing.
The core thesis: prompt engineering is a ceiling. A context graph is a flywheel.
The Two Knowledge Systems
Every organization runs on two knowledge systems.
The one in the database. And the one in people’s heads.
The database stores what happened: transactions, records, timestamps. But the person who’s been doing the job for fifteen years knows why things happened the way they did. Which exceptions were granted. Which patterns to watch for. Which rules matter on paper and which ones actually matter.
That second knowledge system runs most of the real decision-making. And it has no backup.
This is the reason AI agents hit a ceiling. You can give an agent access to every database, every document, every API. But if the judgment layer lives in someone’s head (the pattern recognition, the institutional memory, the “this doesn’t smell right” instinct) the agent will keep making technically correct decisions that any experienced person would override in seconds.
Agents without a context graph are just stateless wrappers around LLMs. The missing piece isn’t better models. It’s structured knowledge that compounds.
The Gap in Motor Insurance
When a surveyor assesses a claim, they don’t just check if the policy is valid and the documents are in order. They remember that the garage on MG Road always inflates bumper costs. That a rear-end collision claiming both a tail light and a boot lid usually means the damage is real. That a vehicle with three claims in two months deserves closer scrutiny, even if each individual claim checks out.
None of this lives in any database. It lives in experience.
So I ran an experiment. An AI agent that processes motor insurance claims one by one, building a context graph as it goes. Every case adds to the collective knowledge: entities, parts, costs, decisions, and the reasoning behind them.
The term “context graph” comes from Jaya Gupta. The idea is that what makes AI agents truly capable isn’t the model, it’s the structured context they accumulate over time.
Here’s what I didn’t expect.
By case 5, the agent started finding its own precedents. Similar accident, similar vehicle, similar amount, and it pulled the past decision to calibrate its confidence.
By case 20, it was flagging things nobody told it to flag:
Cost patterns that didn’t match what it had learned from prior cases
Part combinations that seemed unusual for the type of accident
Repair patterns at specific garages that looked suspiciously consistent
None of these were hardcoded rules. They emerged from the graph growing.
The biggest surprise: making the agent navigate the graph (follow relationships, inspect connected entities, check cross-case statistics) produced far better reasoning than putting everything into a prompt. The structure itself encodes knowledge that flat text loses.
What I Built
A system where:
Every insurance claim becomes a graph: entities (person, vehicle, garage), evidence (invoice, documents), parts (bumper, headlight), and relationships between them
The agent validates claims against knowledge rules (IRDAI regulations, vehicle parts ontology, document requirements)
The agent searches for precedent, including similar past cases, entity history, and human overrides
The agent navigates the graph using tools. It decides what to investigate, follows edges, checks cross-case statistics
Every decision is stored as a decision trace: what was read, what was compared, what the reasoning was
The knowledge graph grows automatically with every case
The flywheel: more cases → richer graph → better precedent → smarter decisions → more trustworthy traces.
Modeling the Graph
Nodes are what a surveyor would recognize: Person, Vehicle, Policy, Accident, Garage, Part, Invoice, Documents. Each gets a deterministic ID from the most reliable field available:
Person  → dl_number → aadhar_no → pan_no → mobile → name
Vehicle → registration_number → chassis_number → engine_number
When the same vehicle appears in case 5 and case 15, it’s the same node. You can ask “how many claims has this vehicle had?”
Edges represent real-world relationships: person DRIVES vehicle, vehicle REPAIRED_AT garage, part DAMAGED_IN accident. Each edge is something a surveyor would draw on a whiteboard.
The Global Layer (Where the Magic Happens)
Beyond per-case graphs, global nodes accumulate across cases:
GlobalPart tracks cost benchmarks:
(:GlobalPart {part_id: "rear_bumper", claim_count: 19,
              avg_claimed: 7200, min: 7200, max: 7200})
CO_OCCURS_WITH captures which parts appear together:
(:GlobalPart {front_bumper}) -[:CO_OCCURS_WITH {count: 11}]→ (:GlobalPart {radiator_grill})
(:GlobalPart {rear_bumper}) -[:CO_OCCURS_WITH {count: 10}]→ (:GlobalPart {tail_light})
After 20 cases, the agent knows: “rear_bumper is typically Rs.7,200, always in rear_center zone, and 53% of the time appears with tail_light.” Nobody programmed this. The graph learned it from data.
The Validation Layer
IRDAI regulations and domain knowledge encoded as rules that read specific nodes and produce VERIFIED, CONFLICT, or ANOMALY edges:
Rule What It Checks Source policy_active policy.end_date >= accident.date IRDAI Regulations 2024 dl_valid DL expiry >= accident date Motor Vehicles Act 1988 parts_plausibility Claimed parts reachable from impact zone Vehicle parts spatial ontology document_completeness All required documents present IRDAI regulations
The parts plausibility check uses a spatial ontology: 74 parts and 206 adjacency edges modeling how damage propagates through a vehicle. Rear bumper claimed for a rear impact? Propagation score 1.0, consistent. Front bumper claimed for a rear impact? Propagation score 0.015, anomalous.
The ontology is a reference graph the agent consults: spatial reasoning, not hardcoded logic.
The Agent Loop (Where Context Graph Meets Agentic Reasoning)
The key design choice: the agent is not a linear pipeline. It’s a loop where the LLM has tools to navigate the graph and decides for itself what to explore.
Tools the LLM Can Call
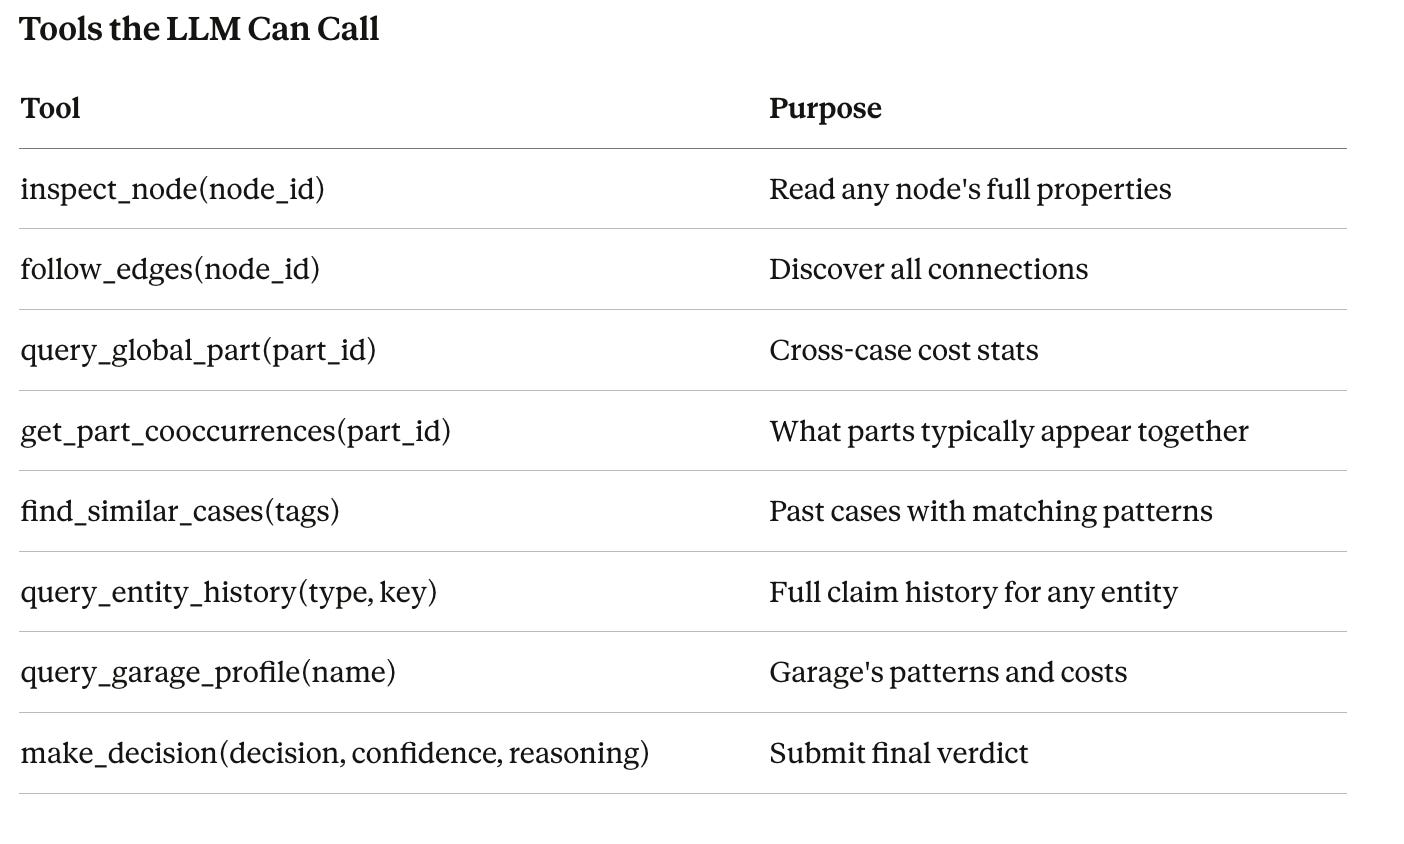
The LLM typically makes 4-8 tool calls per case. For clean cases, it checks a couple of parts and decides. For suspicious cases, it digs deeper, following edges, checking history, profiling the garage.
Nobody told the LLM to check part costs or co-occurrences. The LLM decides what’s worth investigating based on what it sees in the graph. This is what makes it agentic rather than scripted.
Watching the Agent Investigate (A Real Case)
Case C-002: Rajesh K. is driving a vehicle insured under Suresh M.’s policy. Side impact at an intersection. Three parts claimed: side mirror (Rs.2,800), door panel (Rs.12,000), running board (Rs.3,500). Total: Rs.18,300.
The agent’s actual investigation:
[THINK] "I see a driver-policyholder mismatch. Let me investigate."

[ACT]  inspect_node(person:TN31XXXXXXXX)
       → name=Rajesh K., relation_to_insured=self, insured_name=Suresh M.

[ACT]  inspect_node(policy:0407XXXXXXXX)
       → insurer=Insurer Co. Ltd, sum_insured=388864, active

[ACT]  query_global_part(rear_view_mirror)
       → 17 past claims, avg Rs.2,800

[ACT]  query_global_part(door_panel)
       → 16 past claims, avg Rs.12,000

[ACT]  query_global_part(running_board)
       → 11 past claims, avg Rs.3,500

[ACT]  get_part_cooccurrences(rear_view_mirror)
       → door_panel co-occurs 8 times, running_board 8 times
       → Pattern is typical for side impacts

[ACT]  make_decision(APPROVE, confidence=0.95)
       → "Driver-policyholder mismatch noted but AUTHORIZED_BY edge exists.
          Parts costs match cross-case averages exactly.
          Part combination typical for side impacts.
          4 similar precedent cases all APPROVED."
Notice: the agent chose to inspect the person node because it saw the mismatch. It chose to verify every part cost. It chose to check co-occurrence patterns. The graph gave it the information. The tools gave it the agency. The LLM connected the dots.
How Precedent Makes the Agent Learn
Before deciding, the agent queries four sources:
1. Entity History. Has this vehicle, person, or garage been in a claim before? A vehicle with 3 claims in 2 months is different from one with its first claim.
2. Tag-Based Similar Cases. Past cases with overlapping tags (impact zone, severity, vehicle type). Four similar cases all APPROVED? High confidence. Two DENIED? Mixed signals, lower confidence or escalate.
3. Dimension Matching. Numerical similarity across case attributes. Architecture supports vector/cosine search for scale.
4. Human Override History. Cases where a human corrected the agent. If a human changed APPROVE to ESCALATE because “front bumper at Rs.12,000 but market rate for Swift hatchback is Rs.6,000,” the agent sees this correction and adjusts on similar patterns.
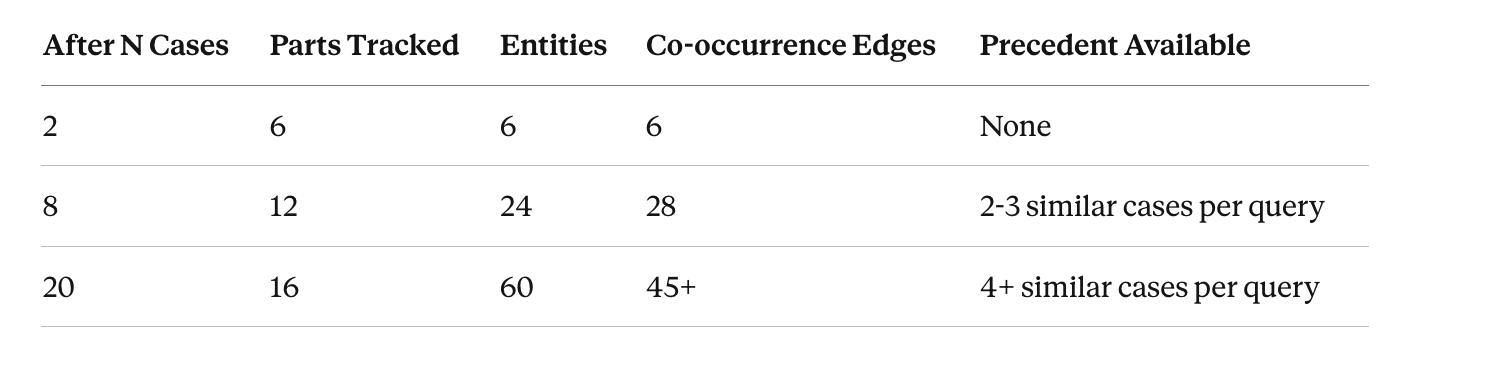
All four sources merge into the LLM context before it decides. The LLM doesn’t follow a formula. It weighs everything contextually. This is how precedent compounds. Case 1 has zero precedent. Case 20 finds 4+ similar cases. At case 1,000, the agent would have deep precedent for every pattern: not just “similar cases” but “similar cases at this garage, with this vehicle type, in this impact zone, with these parts.”
How the Graph Evolves
Business Impact: What This Unlocks
This isn’t just a technical exercise. The context graph creates measurable business outcomes:
Speed. Clean cases (strong precedent, no anomalies, low amount) can be fast-tracked. The graph provides the confidence signal. A claim that matches 10 prior approvals with identical part costs doesn’t need 30 minutes of human review.
Fraud detection that emerges, not programmed. The agent catches a garage that always claims the same three parts at identical prices. Not because someone wrote a fraud rule. Because the graph made the pattern visible. This is cheaper and more adaptive than rule-based fraud systems.
Reduced human dependency without removing humans. Surveyors review the hard cases instead of every case. The decision trace means they can see exactly why the agent decided what it did, and correct it. Those corrections feed back into the graph.
Regulatory defensibility. Every decision has a full audit trail: which nodes were read, which rules applied, what precedent was found, what the reasoning was. In a regulated industry, “the AI said so” isn’t acceptable. “The AI checked these 6 rules, found 4 similar precedents, verified costs against 16 data points, and here’s the reasoning” is.
Directional hypothesis: A mature context graph processing 1,000+ claims should reduce average claim processing time by 40-60% while catching cost anomalies that manual review misses at scale.
What Worked and What Didn’t (Honest Assessment)
What worked:
The LLM genuinely navigates the graph. It’s not a fancy database. The agent follows edges, checks cross-case stats, references specific nodes in its reasoning
Decision traces are powerful for audit and trust
Part co-occurrence patterns and cost benchmarks emerged naturally from data
The tool-calling loop gives the agent real investigative agency
What didn’t work yet:
All 20 cases approved (the test data had no critical conflicts: valid DLs, active policies, reasonable costs). This validated the happy path. Adversarial testing with expired policies, inflated costs, and invalid documents is next
Tags are too uniform. Precedent search finds too many matches because tags aren’t discriminating enough
Missing data is the biggest problem: 100% of cases had no impact_zone, severity, or vehicle body_type in the ground truth
The gap I haven’t closed yet: image reasoning. A real surveyor looks at photos. Tying visual evidence to graph nodes (”this dent pattern is consistent with a side impact”) is the next frontier. Part can be tied to 1000 images and other cases which can be used for reasoning.
What I Intentionally Kept Simple
NetworkX for in-memory per-case graphs (fast, no server needed for prototyping)
Neo4j for persistent cross-case graph storage
Custom ReAct loop with litellm (not LangChain/CrewAI. I wanted full control over graph construction and trace capture)
No vector database. Overkill for 20 cases. In-memory dimension matching is sufficient. Would add for 1,000+ cases
No LLM fine-tuning. The context graph gives the LLM enough information to reason well. Structured context beats fine-tuning for this use case
Conclusion: The Context Graph Flywheel
The next generation of agents won’t be better because of better models. They’ll be better because they accumulate context.
Every case processed adds entities to the global graph, cost data points for benchmarking, co-occurrence patterns, decision traces for precedent, and validation results that test rule effectiveness. The agent’s first case is a cold start. By case 20, it’s checking costs against 15+ data points and finding 4+ similar past cases. By case 1,000, it would have garage profiles, seasonal patterns, segment-specific cost curves, and a library of human corrections teaching it where its initial judgments were wrong.
The surveyor’s intuition isn’t magic. It’s pattern recognition from hundreds of cases, compounding silently over a career. A context graph captures that same compounding, except it never degrades, never retires, and every new case makes every future case smarter.
The hard part isn’t the technology. It’s modeling the domain correctly and feeding the system enough real data. The flywheel of knowledge graph, agent learns, agent gets better: that’s buildable today.
I’m just getting started.